Tuesday, November 27, 2012

Activity: Energy bands of a Semiiconductor

2012/11/17
In this activity, from the formula we just derived h=eVlumda/c, we can measure the voltage across the LED and lumda we can use the formula lumda=dsin(theta), where sin(theta)=l/sqrt(l^2+L^2). The values, e and c are known constants.So we can calculate the h.
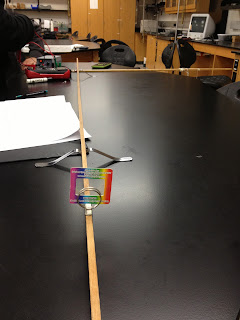
First, we set up the equipment. The picture shown below is to measure the l and L to calculate the wavelength lumda.
 Then we need a power source which is adjusted to 3V, and connect to a resistor and LED. We change the resistance when the LED looks dim then measure the voltage across the LED by using Voltagemeter.

Then we put the LED on the other side like the first picture and measure l and L for each LED.
Here is the data we measure and record. Since we know l,L and d, we can calculate the lumda for each LED.
After we measure all the voltages and wavelengths for each LED,then we can use the formula to calculate h. h=eVlumda/c.
As you can see, the error between our measurement and theoretical value is so big. I guess the big error cause from the voltage. It is so hard to make the LED looks dim. Furthermore, the wavelength we measure and calculate is OK, so the only problem in our activity is measuring the voltage across the LED. 
Tuesday, November 20, 2012

Activity 2


 For question 1, we can see the three pictures below. They prove that the statement is true.
 7+2+2=13
 14+3+10=27
 18+19+3=40
For question 2, we can see the two pictures below.

 As you can see, the direction in Spontaneous emission is odd.
For question 3, the time is not constant to excite.
For question 4, the direction in stimulated emission is the same. You can see the two pictures below.

For question 5, we can find that when the pumping level is 70, n2 is smaller than n1. When the pumping number is 80, n2 is bigger than n1. Thus,we guess the pumping level is 75. Check the pictures below.

 For Question 6, we find that the direction is odd at the result of Spontaneous emission.


Tuesday, November 13, 2012

COLOR AND SPECTRA

11/13/2012
 1.THE SPECTRUM OF WHITE LIGHT
FIRST WE SET UP THE EQUIPMENT. USE A STRAIGHT FILAMENT LIGHT BULB AS A WHITE LIGHT SOURCE. HOLD A DIFFRACTION GRATING 2 TO 5 CM IN FRONT OF ONE EYE.
 WE CAN LOOK FOR A RAINBOW OF COLORS ON EITHER SIDE OF THE BULB.
THE FOLLOWING PICTURE IS SHOWING THE SPECTRUM OF WHITE LIGHT.
THEN WE MEASURE THE DISTANCE OF EVERY COLORS AND COLLECT THE DATA.
 THEN WE USE THE EQUATION TO SOLVE FOR WAVELENGTH OF RED, BLUE, GREEN LIGHT. NOTICE THAT WE NEED TO USE LINEAR TRANSFORMATION TO CALCULATE THE FINAL WAVE LENGTH OF LIGHT.THE FOLLOWING PICTURE IS THE ANSWER WHAT WE GET.
 2. SPECTRA OF A HYDROGEN GAS
REPLACE THE SOURCE WITH A HYDROGEN GAS TUBE. BE CAREFUL, THERE IS ABOUT 5000 VOLTS ACROSS THE EXPOSED TERMINALS OF THE POWER SUPPLY.

 THE FOLLOWING PICTURES ARE THE SPECTRA WE SEE IN A HYDROGEN GAS.AND REPEAT MEASURING THE DISTANCE AND COLLECT DATA.


 USE THE SAME EQUATION ABOVE TO SOLVE FOR THE BRIGHTER LIGHT. ANYWAY, WE ONLY SEE THREE LINES IN SPECTRA.THEN WE ALSO CALCULATE THE THEORETICAL DATA BY USING THE DEFINITION EQUATION AND WE ALSO CALCULATE THE ERRORS BETWEEN THOSE DATA. SINCE WE GOT A BIG ERRORS IN THE PREVIOUS PART,IN THE PART WE GET A BIG ERRORS TOO.
 3.CHALLENGE
WE REPLACE AN UNKNOWN TUBE AND REPEAT THE STEPS ABOVE.
 HERE ARE WHAT WE SEE IN SPECTRA.

HERE'S THE THING, BECAUSE WE DON'T KNOW WHAT GAS IT IS, WE COMPARE TO THE SOURCE ONLINE WHICH IS A SPECTRAL LINES CHART. 
 AFTER CALCULATING THE WAVELENGTH AND COMPARE TO THE SPECTRAL LINES CHART, WE DETERMINE THE GAS IS HELIUM.
FINALLY, OUR PROFESSOR TELLS US OUR GUESS IS CORRECT!!!!!!!!!!!

Monday, November 12, 2012

Visualizing Wave Packets

11/12/2012
The following python program demonstrates how to plot a Gaussian Function:
from pylab import*
center =5
sigma=1
coeff=1/sqrt(2*pi)*sigma
gauss_list=[]
for x in arange(0,10,0.1):
    gauss=coeff*exp(-(x-center)**2/(2.*sigma**2))
    gauss_list.append(gauss)
plot(gauss_list)
show()

The following python program demonstrates how to plot a multiple sine functions:

from pylab import*
A=1
w=1
for i in range(1,4):
    x=[]
    sine_function=[]
    for t in arange(-3.14,3.14,0.01):
        sine_f=A*sin(i*w*t)
        sine_function.append(sine_f)
        x.append(t)
    plot(x,sine_function)
show()

The following python program demonstrates how to plot the superposition of sine function:

from pylab import*
A=1
w=1
Fourier_Series=[]
for i in range(1,3):
    x=[]
    sine_function=[]
    for t in arange(-3.14,3.14,0.01):
        sine_f=A*sin(i*w*t)
        sine_function.append(sine_f)
        x.append(t)
    plot(x,sine_function)
    Fourier_Series.append(sine_function)
superposition=zeros(len(sine_function))
for function in Fourier_Series:
    for i in range(len(function)):
        superposition[i]+=function[i]
plot(x,superposition)
show()


The Gaussian Wave Packet.

from pylab import*
sigma = 2.5
halfHarmonicsNumber = 0 ## total harmonics number is 5
center = 0
w = 0.4*pi
A = 1
number = 1
Fourier_Series = []
coeff = 1/sqrt(2*pi)*sigma
for k in range(0, number+1):
    x = []
    sine_function = []
    for t in arange(-31.4,31.4,0.01):
        gauss = coeff * exp(-(t - center)**2/(2. *sigma**2))
        sine_f = gauss * A * sin(k*w*t)
        sine_function.append(sine_f)
        x.append(t)
    #plot(x,sine_function)
    Fourier_Series.append(sine_function)
superposition = zeros(len(sine_function))
for function in Fourier_Series:
    for i in range (len(function)):
        superposition[i]+= function[i]
plot(x,superposition/number)
for j in arange(-10,11,5):
    print coeff * exp(-(j*1.0/2 - center)**2/(2. *sigma**2))
show()


0.134977416283
0.604926811298
0.997355701004
0.604926811298
0.134977416283

Exercises:
a.

b.
                                    c.L
                                    d.2L
                                    e.2L
                                    f.h
                                    g.h
                                    h.no matter what k of 0 is, omega of p times omega of x equal to h.


Monday, November 5, 2012

Project pre-proposal

2012/11/5

Name: Zhuohong Kuang(Ivan)    ivankuang1989@gmail.com
            Yiteng Guan(Austin)     yitengguan@gmail.com

First idea: AM/FM mp3 transmitter which can transmitter am or fm signal from mp3 to a radio so that people can listen to their favorite music from their mp3 without any aux lines.


Second idea:
In order to help smokers who always travel and forget to take their lighters to light their cigarette conveniently, we design a lighter which uses sunlight to light cigarette without using traditional way--fire.


Third idea: design an apparatus that can measure the distance between two things by using light or sound.


Forth idea:
A decoration that can move automatically in the water.